Trace Driven Development
Darklang flows from end user experience through to the backend components. If you would like to see any of the code from this document, the sample canvas that goes along with it is: https://darklang.com/a/sample-introtodark
Sending Requests to Darklang
Send requests to Darklang before writing code. There are several ways to do this:
- Build your frontend or mobile app first and point your API endpoints at Darklang (you can host your frontend on Darklang by uploading your static assets via CLI).
- Use another platform that makes requests via REST (Slack, Twilio, Shopify) and use Darklang with existing webhooks or calls.
- Use postman, curl, or another tool of your choice to send test data in the correct shape to your API endpoints. This is the easiest way to get started, and you can try it out by following the rest of this doc.
Using Browser & Curl for Requests
GET Requests
- Open your canvas (darklang.com/a/USERNAME-CANVASNAME).
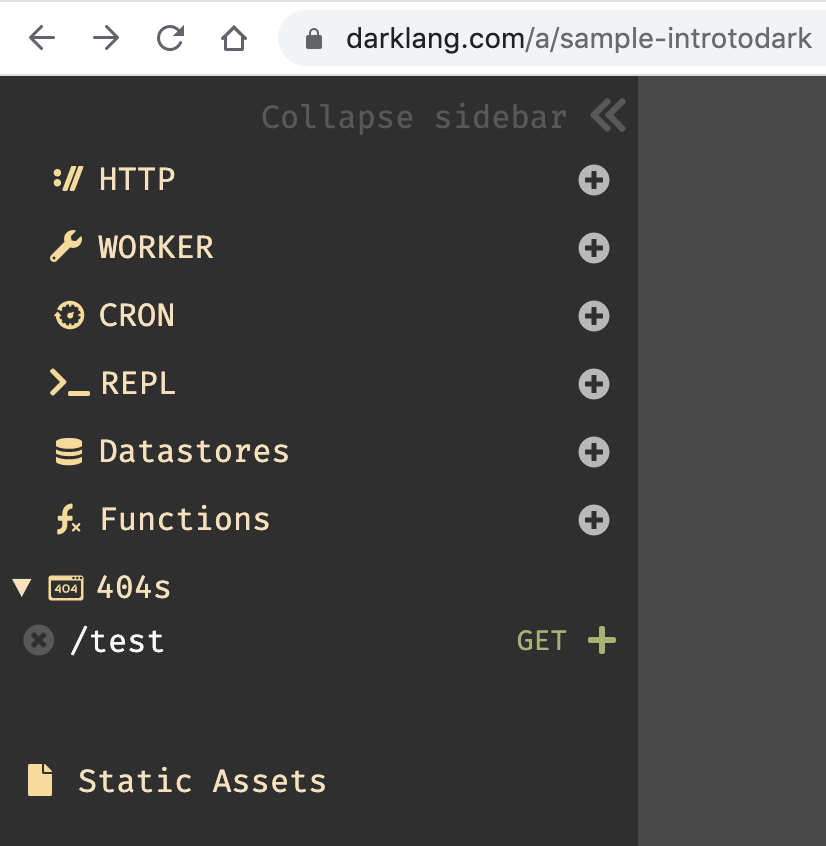
- In another tab, visit username-canvasname.builtwithdark.com/test (ex: https://sample-introtodark.builtwithdark.com/test).
- Go back to Darklang and check in the 404 section.

You’ll be able to create the endpoint and see the full request (including any
query params if you add them - i.e. test?name=paul). Each request shows up as
a trace on the left hand side of the handler as a gray dot, or a white dot when
selected.
You can work with the selected trace. In this case, the handler is set to return the "accept" field within the header. If the caret is in the text of “request” you’ll see the full request, in “headers” the full header, and in this case the caret is in "accept," which means we see only that field to the left.
If you do not select a trace, you’ll see spinners for all live values.
One current limitation is that you can only write code for existing traces (trying to access something that doesn’t exist will not allow you to write the code). We’re working on it.

POST Requests
Open terminal and curl:
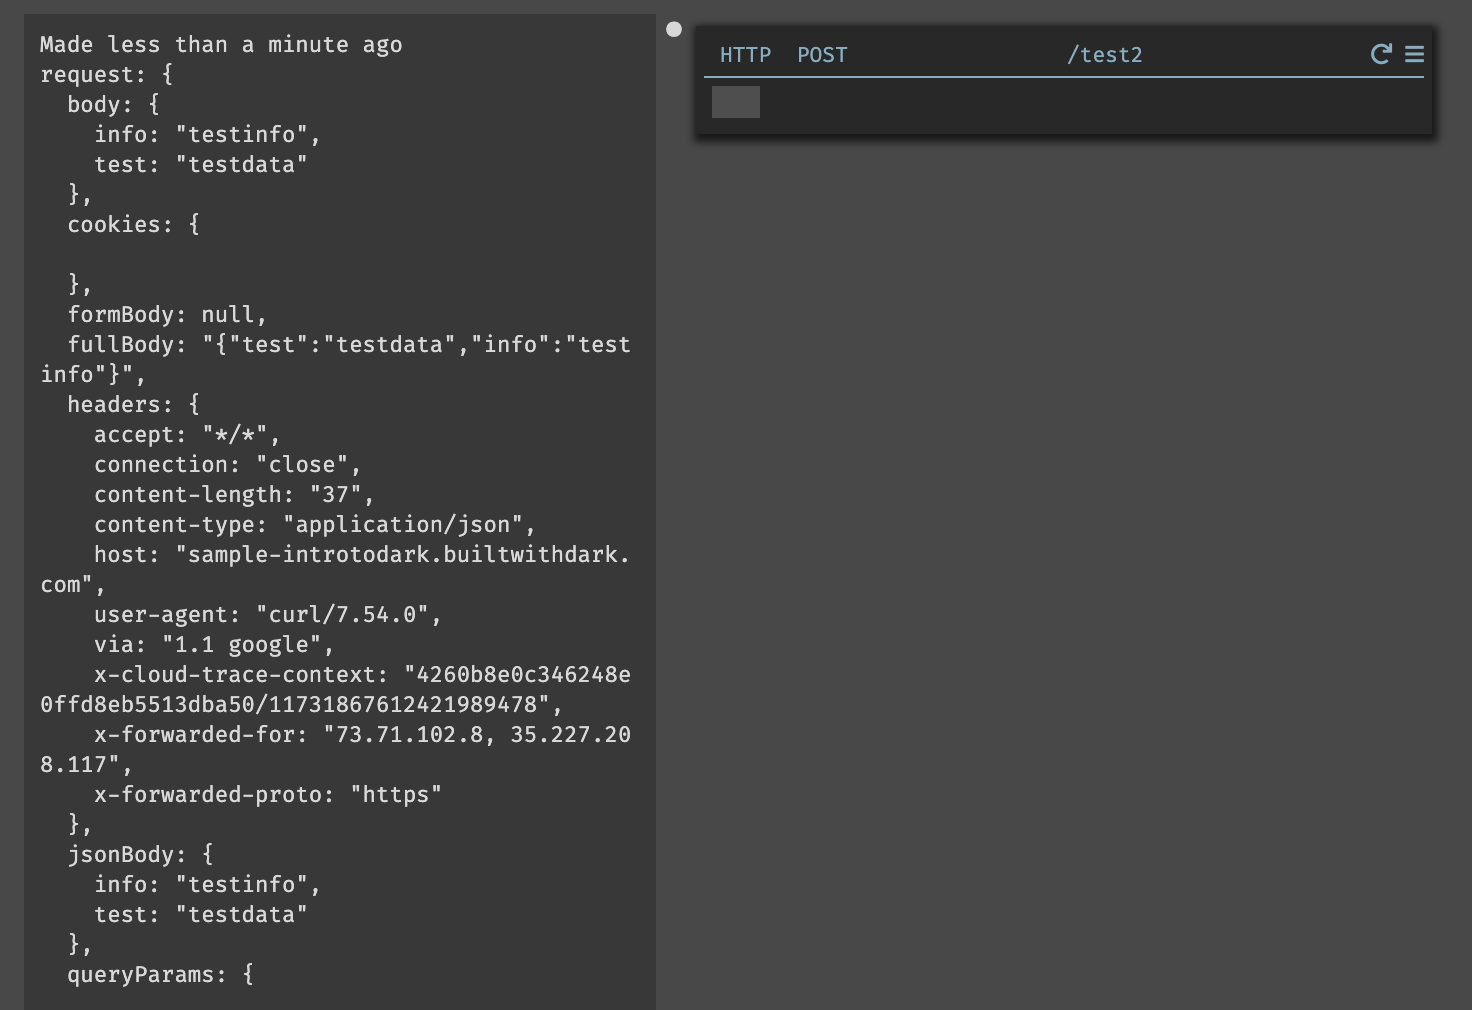
curl -X POST -H 'Content-Type: application/json' https://username-canvasname.builtwithdark.com/test2 -d '{"test":"test data","info":"test info"}'

When you create the route you’ll see the recent traces as white dots on the left. You can select a given trace by clicking on it and then you’ll see all expressions evaluated for that request.

Similarly to the get request, you can work with the real data from the trace. In
this case the handler shows request.body.info.

You can select which trace you are using when evaluating your code. Below, there are three recent traces, and we’re seeing the value of “info” for the most recent.

Live Values & Play Buttons
Once you have requests/traces, you can use them while writing code.
When you write code, if you put your cursor into the code, you will always see the result of that code for the selected trace on the left hand side. These left-hand-side values are called "live values."
As seen above with testinfo, expressions will automatically show you their
values to the left if they have no side effects. Below, we see the result of the
addition:

When an expression does have side effects (like changing a value in a datastore or calling an external API) it will have a green “play” or “replay” button that allows the developer to choose to run it for the current traces.
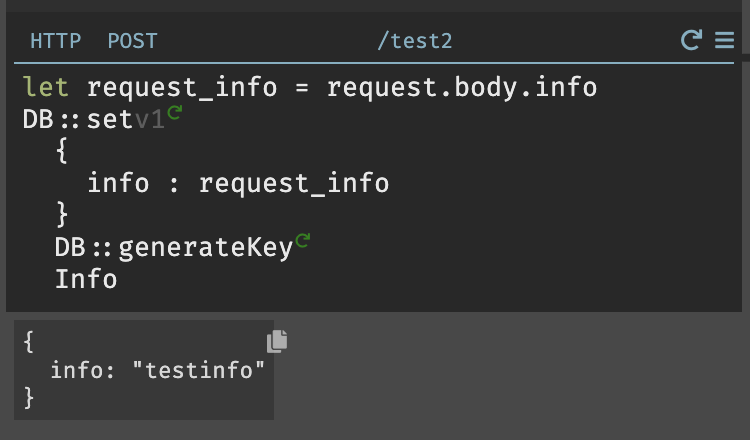
In our earlier request, if we saved request.body.info to the variable
request_info, we could then choose to insert it into a datastore. In this
case, there’s a play button to generate a new key, and a second one to insert
the information:

Once you play the DB::generateKey, you can see the resulting key, and choose
to play the DB::set expression:

When you play DB::set, you can see the record that was inserted:

Replay Entire Trace Button
If you wish to replay the entire trace, you can use the “replay” button next to the hamburger menu in the upper right of the handler.

Return Values
When on a handler, you’ll also see a live value at the bottom that corresponds to the value a handler returns. Darklang has implicit returns (more on this in Functional Aspects of Darklang).
